MCAS Assessments
MCAS provides information throughout the state in order to identify the wide range of student achievement in typical grades (Massachusetts does not report data at the classroom level). Filters can be selected to produce charts for any district, school, and grade.
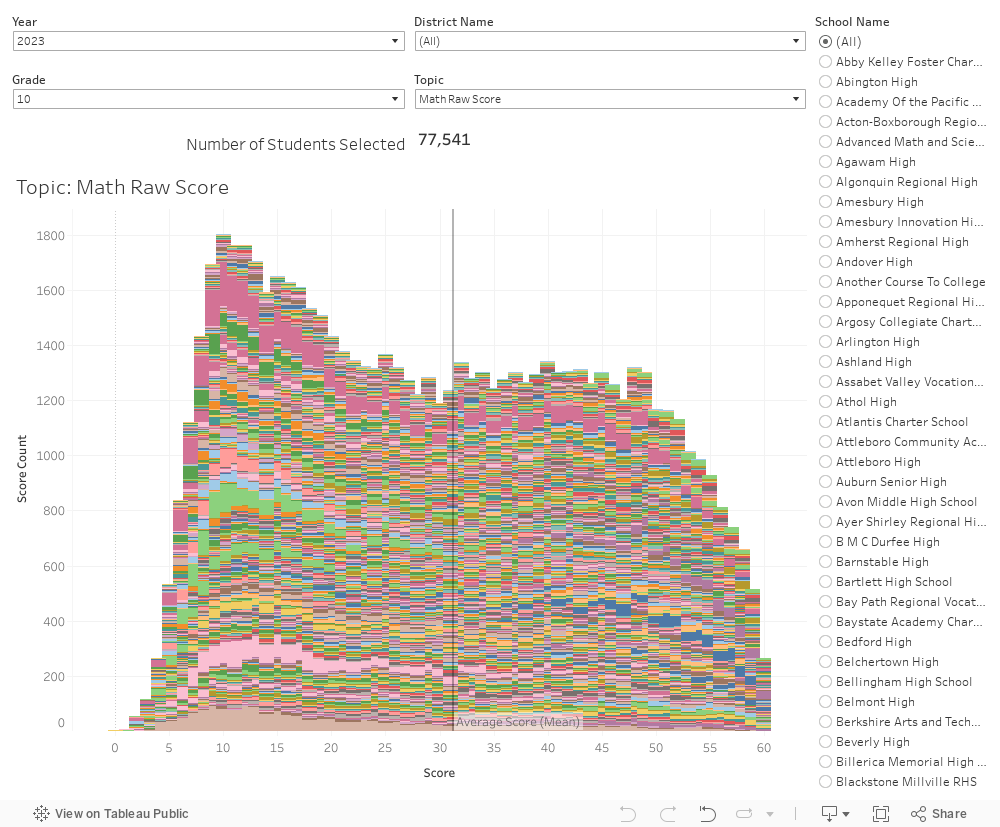
These data visualizations illustrate the range of achievement and learning readiness found within each classroom. Students are typically assigned to widely-heterogenous-by-achievement, age-based classrooms. This leads to undo strain on teachers to teach a multitude of levels simultaneously. Furthermore, it creates an environment that counters engaging many students who achieve well above or well below average when they are all being instructed at the same age-average content in a single grade.
Distribution of Student Raw Scores on MCAS Assessments - Beta
How to use these charts
The current data includes student results for the MCAS. Selections can be made by year, school district, school, and grade.
YEAR - There are several available years to select from. We’ll add more years as data becomes available.
DISTRICT NAME - School district names (or individual schools if it doesn’t belong to a specific school district) may be selected from the drop-down menu.
SCHOOL NAME - All the schools in a specific district will be displayed if you want to view a specific school. Select the “All” option to see the aggregated data for a district.
GRADE - You can select a specific grade to view. Select the “All” option to see all grades aggregated data.
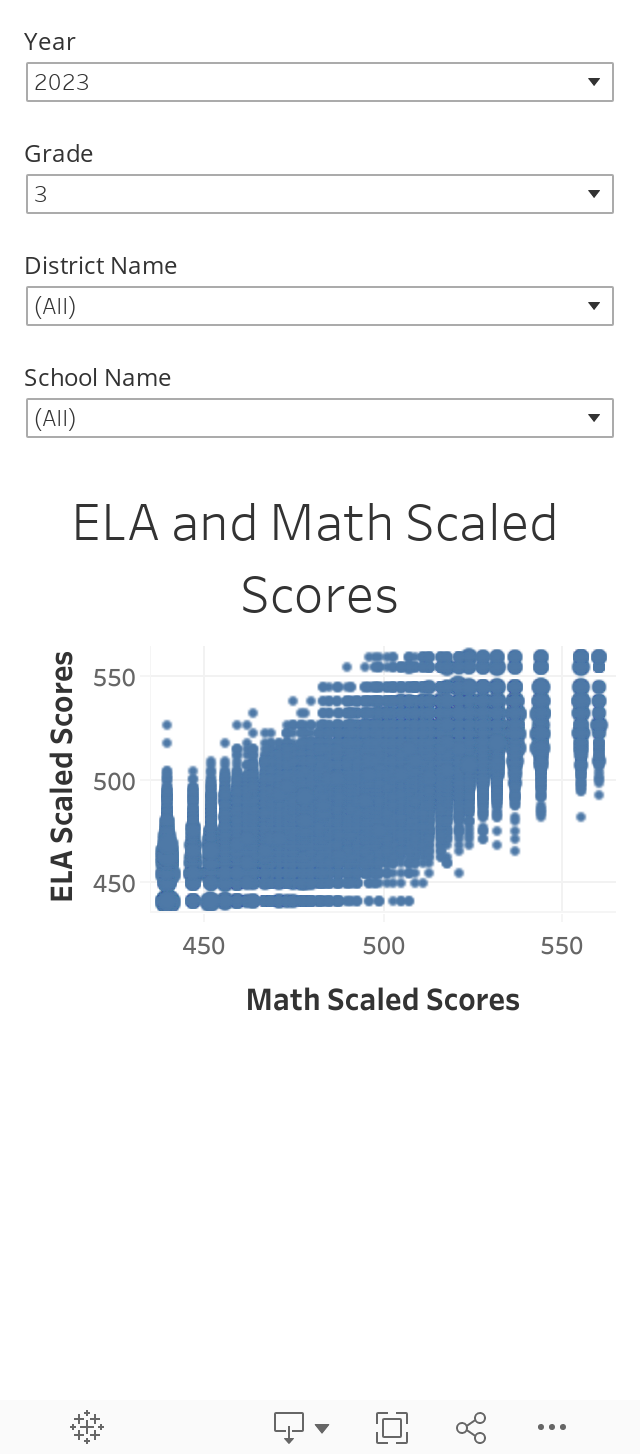
The Math and ELA Scaled Score comparison can be seen below aggregated by the number of students with the same combination of scaled scores. You can also select grade and district name on the filters.